Chart Recorders
A chart recorder is a precision instrument designed to record electrical or mechanical trends directly onto a rolling piece of paper. These devices capture various inputs, utilising a set of circular chart pens or strip pens that operate simultaneously to plot data on strip or circular charts.
There are mechanical, electrical, and electro-mechanical chart recorders, and while traditional paper recorders remain valued for creating permanent, tactile graphs, modern digital chart recorders are becoming the standard. These electronic models allow for seamless data transfer to computers, facilitating easier storage and in-depth comparative analysis.
How Chart Recorders Work?
The core of a chart recorder is its drive mechanism. The device utilises a high-precision motor to move the strip chart recorder paper at a constant, predetermined speed, which represents the time axis. Simultaneously, a galvanometer or servo motor responds to input signals, such as voltage or 4-20mA loops, to move the pens across the paper. This movement represents the data axis, resulting in a continuous, scaled graph of the measured process.
Chart Recorders Types
Selecting a chart recorder depends on your specific data visualisation needs. Most units are categorised by their physical format and recording method:
- Strip Chart Recorders: Also known as paper chart recorders, these utilise a long roll of strip chart recorder paper. They are popular in laboratories and industrial process measurement for tracking continuous, long-term trends.
- Circular Chart Recorders: Similar to strip chart recorders, these record data onto a rotating disc. A circular chart recorder is ideal for batch processing, providing a complete 24-hour or 7-day snapshot of a process on a single sheet.
- Hybrid Recorders: These provide immediate visual feedback of a traditional recorder with the digital storage capabilities of a data logger.
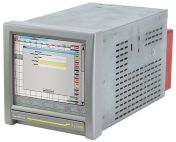
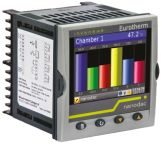
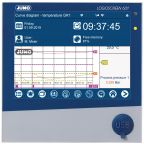
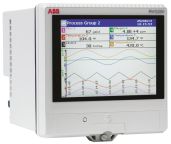
- Paperless Recorders: Often called a digital chart recorder, these gather data electronically and display it on a screen. The digital files can then be moved to a PC for analysis, eliminating the need for physical paper.
Applications of Chart Recorders
Chart recorders are essential for maintaining quality control and safety in various industrial sectors:
- Manufacturing & Process Control: In manufacturing and water treatment, a strip chart recorder is used alongside a liquid level sensor or pH meterto provide a redundant, paper-based backup of critical data. In HVAC and cooling systems, a temperature chart recorder paired with a high-accuracy RTD sensor ensures that environmental conditions remain within strict regulatory limits.
- Timber & Agriculture: A paper chart recorder is frequently used by wood merchants to monitor moisture levels during the drying process. This ensures the timber reaches the correct structural grade before being sold or used in construction.
- Laboratory & Healthcare: Laboratories rely on a strip chart recorder to document continuous experiments or to monitor the environmental stability of medical storage units, where consistent conditions are legally required.
How to Install Chart Recorders
To ensure your chart recorder provides reliable and accurate data, follow this balanced installation and maintenance guide:
- Select Mounting Method: Depending on your workspace, perform a panel mount into a control cabinet or a surface mount onto a flat wall. Ensure the unit is at eye level for easy monitoring.
- Connect Input Signals: Wire your sensors (such as thermocouples or 4-20mA loops) to the rear terminals. For an electrical chart recorder, proper grounding is essential to prevent signal noise from distorting the graph.
- Align the Recording Media: Load the strip chart recorder paper or circular disc into the drive. It is critical to align the paper perfectly with the sprockets to prevent jams or time-axis errors.
- Configure the Pens: Carefully snap the circular chart pens or strip pens into the servo arms. Verify that the tips make light contact with the paper, as too much pressure causes tearing, while too little leads to skipping.
- Perform Calibration: This is the most vital step. Test the input signals to ensure the pen’s physical position accurately matches the chart's graduations (e.g., ensuring a 5V signal aligns exactly with the 50% mark).
- Set the Time Axis: Sync the chart to the current time and activate the drive motor. Observe the first few minutes of operation to confirm the paper is advancing at a constant speed.
How to Choose the Right Chart Recorders
When selecting a unit, consider the following factors:
- Input Type: Ensure the recorder can handle your signal (e.g., 4-20 mA, Thermocouple, or RTD).
- Duration: Decide if you need a 24-hour snapshot (Circular) or a long-term continuous record (Strip).
- Digitisation: Determine whether you require physical paper chart recorder archives or a digital chart recorder for your data analysis workflow.
- Accuracy: Check the sampling rate and pen response time to ensure it matches the volatility of your measured process.
Buy Chart Recorders Online from RS Australia
RS Australia is a trusted manufacturer, supplier and distributor of chart recorders, stocking products from leading brands such as ABB, Eurotherm and Honeywell at reasonable prices. Our range covers strip chart recorders, circular chart recorders, and digital chart recorders to suit manufacturing, laboratory, and industrial processing applications. Ordering from RS Australia is easy. Simply filter by input type, pen count, or recording width and add to your cart with real-time stock visibility. Once your order is placed, you can rely on our efficient logistics network for prompt dispatch to your doorstep. To get complete details on our delivery services and charges, please visit ourDelivery Page.


Popular Searches
Related links
- Chart Recorder Accessories
- Jumo 431882 Software for use with Chart Recorders
- Lumel KD7 7 Videographic Chart Recorder Thermocouple
- ABB P100L/7400G Rotary Chart Paper for use with ABB Strip Chart Recorder
- ABB C1911 1 Circular Chart Recorder Thermocouple
- ABB RVG200 1 Paperless Chart Recorder Resistance Thermocouple
- ABB SM501FCB Videographic Chart Recorder RTD, Thermocouple
- Eurotherm 6100A 3 Paperless Chart Recorder Thermocouple